"China Climate Change Blue Book (2022)" was officially released!
Author:China Meteorological Administr Time:2022.08.03

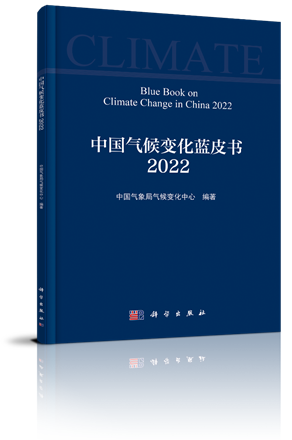
On August 3, the China Meteorological Administration held a August press conference and officially released the "Chinese Climate Change Blue Book (2022)" to the public.
In order to effectively play the role of the basic science and technology support of climate change, scientifically understand the new facts and new trends of climate system changes, and meet the service needs of national and regional response to climate change and green and low -carbon development. Climate Change Blue Book (2022) "provides the latest monitoring information of China, Asia and global climate change. "Blue Book" shows that the global warming trend is still continuing. In 2021, many climate change indicators such as the average temperature of China's surface, coastal sea plane, and many years of frozen soil activity layer have broken observation records.

The comprehensive observation of the climate system and multiple key indicators show that the global warming trend is still continuing. In 2021, the global average temperature is 1.11 ° C higher than the level before industrialization (1850 to 1900), which is one of the seven warmest years since the complete meteorological observation record; The temperature is 1.01 ° C higher than the level before industrialization. In 2021, the average temperature of the Asian land surface was 0.81 ° C higher than the annual value of the year (this report used 1981 ~ 2010), which was the seventh high value since 1901.
China's temperature increase is higher than the global average of the same period, and it is a sensitive area for global climate change. From 1951 to 2021, the average annual temperature of the Chinese watches showed a significant upward trend, with a temperature increase rate of 0.26 ° C/10 years, which was higher than the global average heating level (0.15 ° C/10 years) at the same period. In the past 20 years, it has been the warmest period in China since the beginning of the 20th century; in 2021, the average temperature in China is 0.97 ° C higher than the annual value, the highest value since 1901.
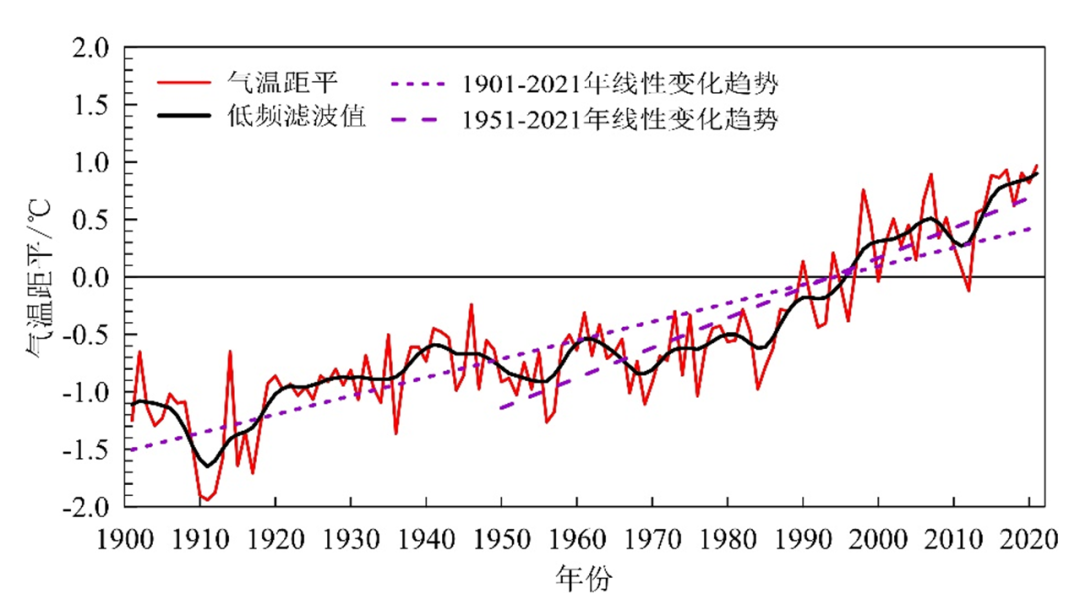
From 1901 to 2021, the average annual temperature of the Chinese watch is flat
(Compared to the average of 1981 ~ 2010)
China's average annual precipitation is increasing, and the differences between the regions of precipitation changes are obvious. From 1961 to 2021, China's average annual precipitation was increasing, with an average increase of 5.5 mm every 10 years; the annual precipitation has continued to be more annual since 2012. In 2021, the average precipitation in China was 6.7%more than the annual value. Among them, the average precipitation in North China was the largest since 1961, and the average precipitation in South China was the least in nearly ten years.
China's high temperature, heavy precipitation and other extreme weather and climate incidents have become more and stronger. From 1961 to 2021, China's extreme heavy precipitation incidents increased; since the late 1990s, extreme high temperature events have increased significantly, and the average intensity of Chinese typhoons has increased. In 2021, the average number of warm days in China has been the largest since 1961. The maximum temperature of 62 days such as Yuanjiang (44.1 ° C) and Sichuan Fushun (41.5 ° C) exceeded the historical pole value. From 1961 to 2021, the average daily dust of the northern region decreased, and in recent years, it has reached the minimum value and has risen slightly.

Since the late 1980s, the warmth of the ocean has accelerated, and the global average sea level has continued to rise. Ocean warming has been significantly accelerated since the late 1980s. In 2021, the global ocean thermal content (upper layer 2000 meters) is 23.5 × 10^22 scorched ear higher than the perennial value, which is the highest value since the modern ocean observation. From 1993 to 2021, the global average sea level rising rate was 3.3 mm/year; in 2021, the global average sea level reached the highest level since the satellite observation record.
The changes in China's coastal sea plane generally have a fluctuation rising trend. From 1980 to 2021, the rising rate of the coastal seas of China was 3.4 mm/year, which was higher than the global average of the same period. In 2021, the average of the coastal sea plane of China was 84 mm higher than from 1993 to 2011, the highest since 1980.
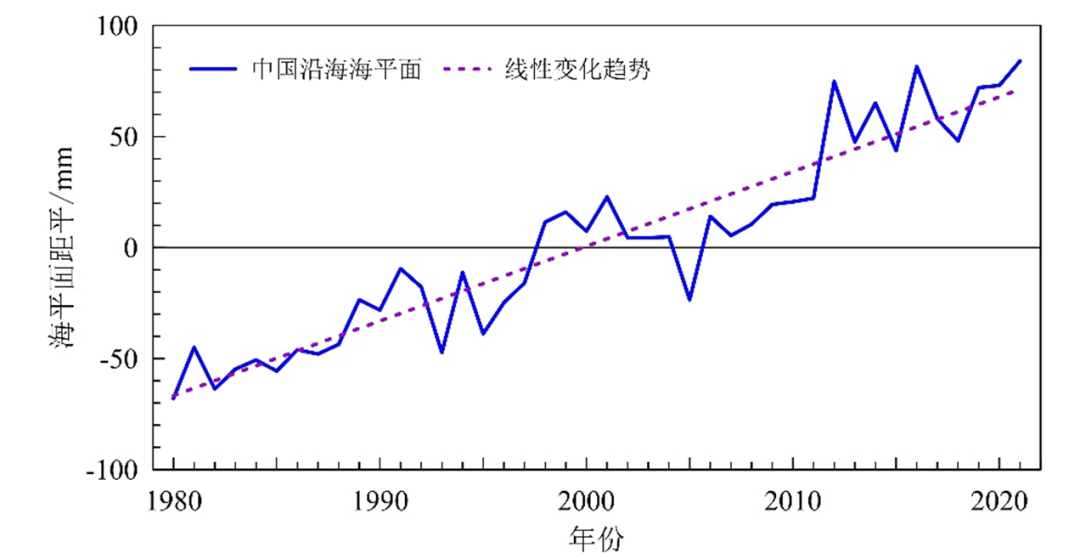
From 1980 to 2021, the plane of the coast of China was flat
(Compared to the average of 1993 to 2011)
The amount of water resources in China has changed significantly, and the water level in Qinghai Lake has continued to rise in the past two decades. In 2021, the amount of water resources in China was close to the perennial value; the Liaohe, Haihe, Yellow River, and Huaihe River Basin were significantly more. few. From 1961 to 2004, the water level in Qinghai Lake showed a significant decline; since 2005, the water level of Qinghai Lake has risen for 17 consecutive years; the water level in Qinghai Lake in 2021 reached 3196.51 meters, which has exceeded the water level in the early 1960s.

Global glaciers are in a state of ablation and retreat, and have accelerated ablation since the mid -1980s. The Glacier No. 1 in Urumqi River, Tianshan, China, the Glacier Glacier in the Altai Mountains, No. 12, Luxou, Qilian Mountains, and the Xiadong Kima Glacier in the Yangtze River Yuanyuan District are accelerating the ablation trend. In 2021, the east of the glacier 1 and west of the Urumqi River, the end of the glacier 1 and the west branch of 6.5 meters and 8.5 meters, respectively.
The Qinghai -Tibet Highway has shown a degradation trend for many years. From 1981 to 2021, the thickness of the activity of the frozen soil area along the Qinghai -Tibet Highway was significantly increased, with an average of 19.6 cm thickened every 10 years; from 2004 to 2021, the temperature at the bottom of the activity (many years of frozen soil) showed a significant increase. In 2021, the average activity layer of the frozen soil area along the Qinghai -Tibet Highway was 250 cm, which is the highest value since the observation record. The thickness of the activity layer of the frozen soil area along the Qinghai -Tibet Highway
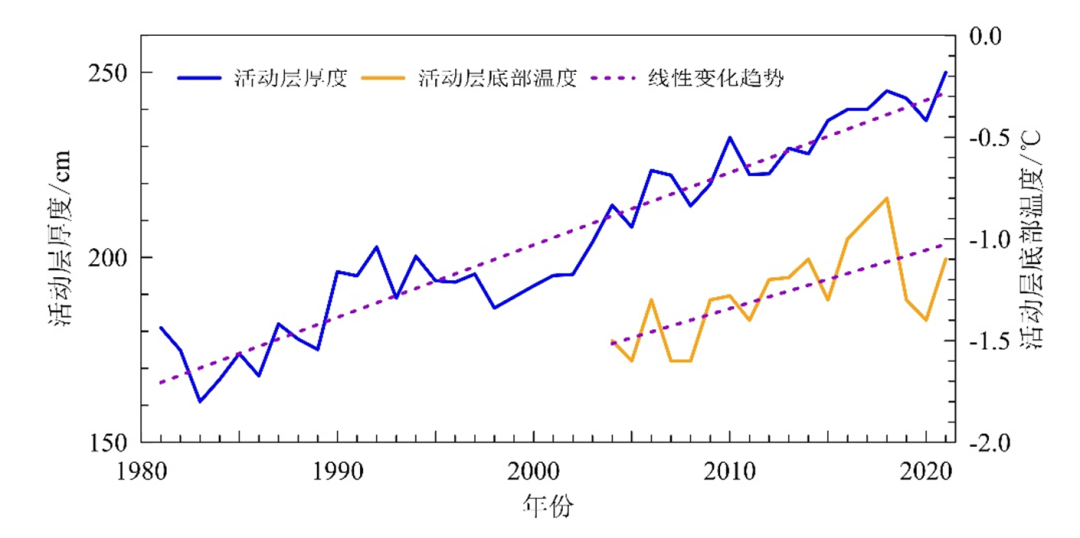
The temperature changes at the bottom of the activity layer
The Arctic Sea Ice range has a significant reduction. From 1979 to 2021, the Arctic Sea Ice range was consistently declined; the average range of Arctic sea ice in March and September decreased by 2.6%and 12.7%, respectively. From 1979 to 2021, there was no significant linear change trend in the Antarctic sea ice; from 1979 to 2015, the range of Antarctic sea ice fluctuated; but since 2016, the scope of sea ice is generally small.
China's overall vegetation coverage has increased steadily, showing a trend of turning. From 2000 to 2021, the average annual normalized vegetation index (NDVI) of China showed a significant upward trend. In 2021, China's average NDVI increased by 7.9%from 2001 to 2020, an increase of 2.5%from the average value of 2016 to 2020, and the highest value since 2000.

Satellite remote sensing (EOS/Modis) from 2000 to 2021
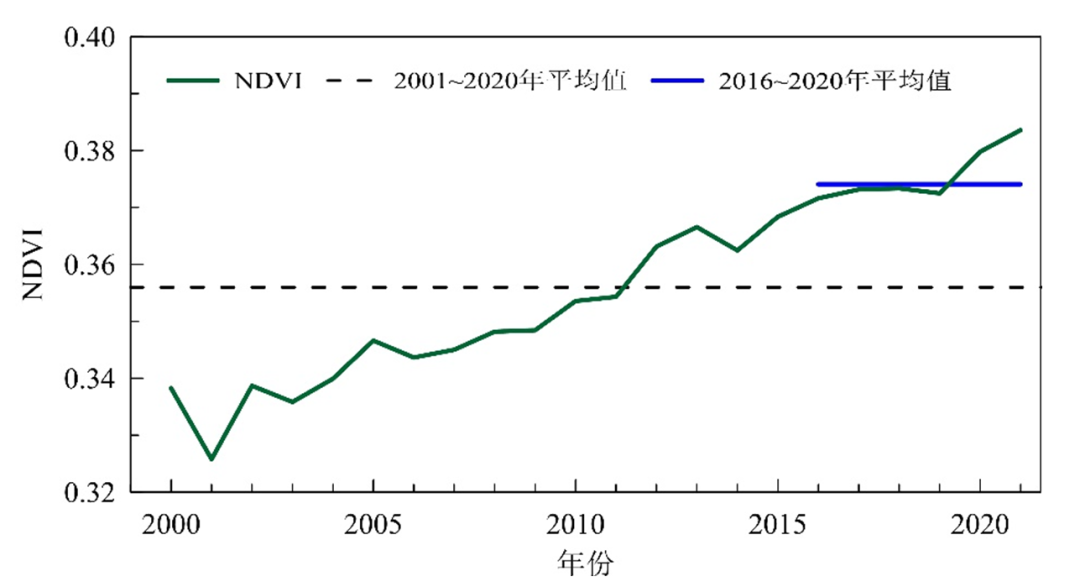
China ’s average annual normalized vegetation index
The representative plants in different regions in China have trended in advance in the spring period, and the autumn period is fluctuating in the autumn period. From 1963 to 2021, Magnolia at Beijing Station, locusting locust at Shenyang Station, Yantiu of Hefei Station, Fengxiangshu Tree at Guilin Station, and the coloring leaf period at Xi'an Station on average per 10 years earlier 3.5 days, 1.5 days, 2.5, 2.5, 2.5 Day, 3.0 days and 2.8 days.
Representative plants in different regions of China from 1963 to 2021
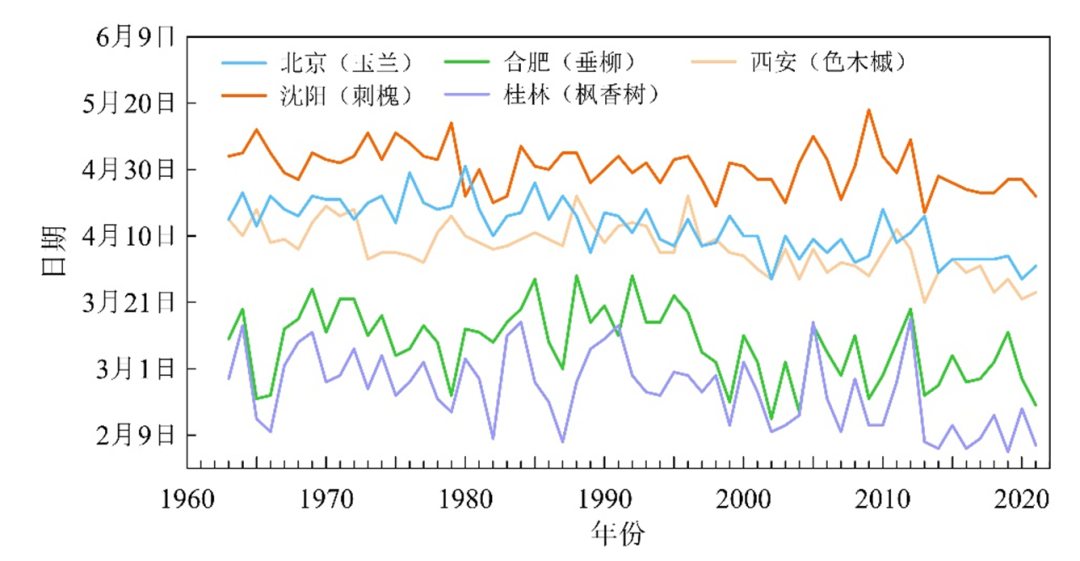
Starting period of the leaf period changes
Since the 1970s, China's coastal mangrove area has generally decreased first and then increased. In 2020, the total area of Chinese mangroves was basically restored to the level of 1980.
China's average annual total radiation has decreased. In 2021, the solar event entered the rise of the 25th activity weeks since 1755. The average of the sun sunspots was 29.7 ± 29.7, which was slightly higher than the 24.9 ± 16.1 relative number of Sun Kuroko in 2010 (2010 To. From 1961 to 2021, the average annual radiation volume received by China's land surfaces decreased; in 2021, China's average annual total radiation was 31.5 kWh/square meters less than the annual value.

The thickness of Chinese gas solution optical is generally declining, and the characteristics of phased change are obvious. From 2004 to 2014, the average fluctuation of gas solution optical thickness (AOD) of the atmosphere of the atmosphere of Beijing in Shangdianzi, Zhejiang, Zhejiang, and Heilongjiang, Zhejiang, and Heilongjiang. From 2014 to 2021, the trend of volatility was shown. In 2021, the average values of AOD in Beijing's Shangdianzi and the Lin'an District atmosphere station (440 nm in the central wavelength) of the atmosphere station (440 nm) of Beijing were 0.34 ± 0.33 and 0.41 ± 0.23, respectively. The average AOD value of the station is 0.30 ± 0.24, which is slightly higher than in 2020.
From 2004 to 2021, Beijing Shangdianzi, Zhejiang Lin'an and Heilongjiang Longfeng Mountain
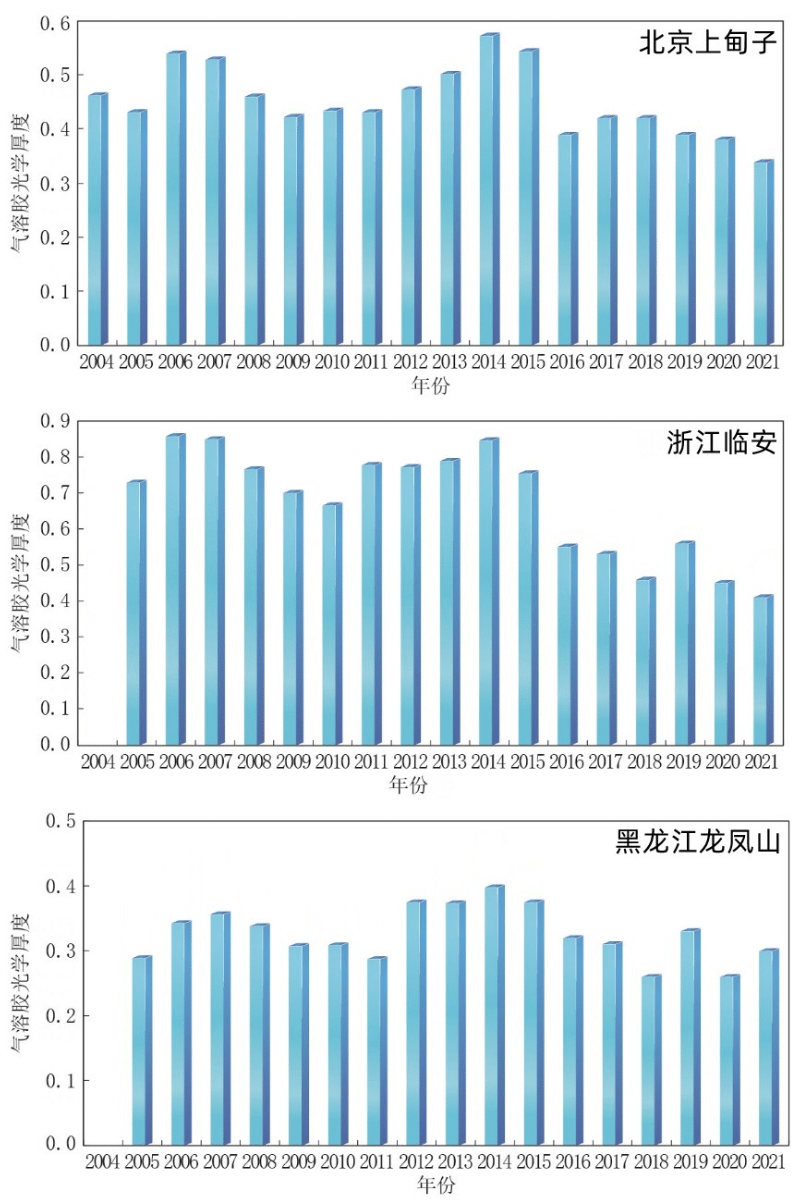
Regional atmospheric base station gas solution optical thickness change changes
Trial number of this report: GS (2022) No. 0344
Chinese climate change blue book (2022) quotation format:
China Meteorological Administration Climate Change Center, 2022. China Climate Change Blue Book (2022). Beijing: Science Press
CMA CLIMATE Change Center, 2022. Blue Book on Climate Change in China (2022).
Produced by China Meteorological Administration Xuanke Center (China Meteorological News Agency)
Source: National Climate Center
Edit: Brush
Review: Duan Haoshu

- END -
Do a good job of preventing and controlling safety risks and resolving corporate business problems ... "Lianxinbao" is here tenth.

In response to the voices of the masses, solving the problems of the masses' urgen...
Anti -scams do not loosen the publicity and do not snooze

In order to help the elderly to improve the awareness of the rule of law and the a...