In June, the first phase of the Chinese Catering Wind Direction Index | Can your category still make money?
Author:Cover news Time:2022.06.23
This is not a simple summary of the past data and the interpretation of the stingy. Instead, based on the data trend and trend of the past 6 months, the predictive conclusions derived from the domestic advanced algorithm have been analyzed. In order to get these predictive conclusions, the cover news combined with octopus small data for 6 years to improve the database and algorithm. After using data to serve a number of head catering companies and achieved good results, we have the confidence to release this Chinese catering wind index.
It is hoped that the truth from the data can answer doubts for everyone, grasp the development of product development and trends, and build a monthly "development barometer" for the catering industry, so that everyone can see the opportunity and the pit.
Category current situation interpretation
Development indexes of catering categories: concentrated reflecting the current domestic consumption status quo.
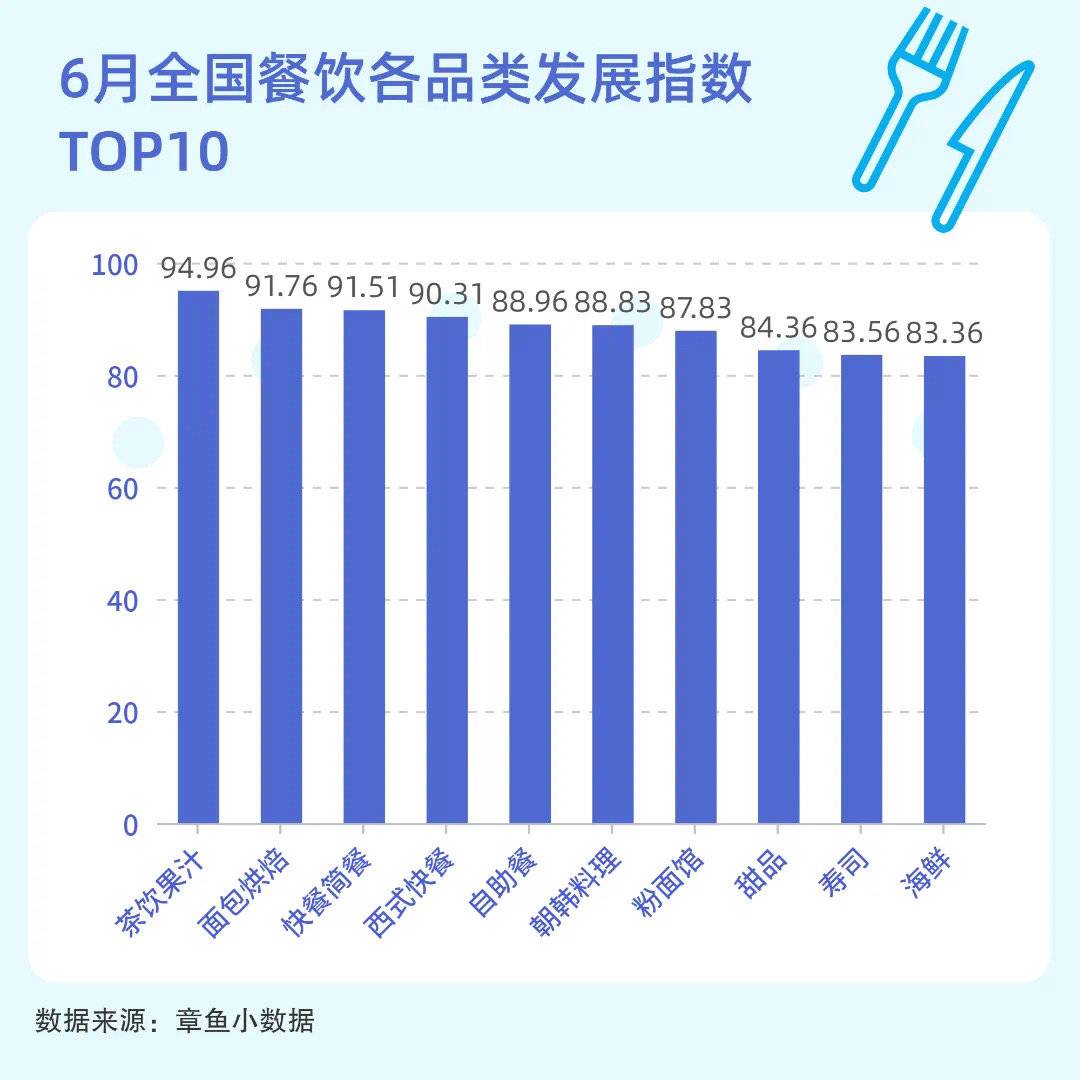
(The index is analyzed based on the relevant trend data of March-June)
(one)
At present, the best categories of development: tea juice and bread baking, their characteristics are very obvious: just need, low -customer unit price
It can be seen that although the survival of the fittest of tea and juice category at the moment is fierce, the development trend of the overall category category is better. Category companies with obvious advantages can still strengthen investment and expand development, but the new brand must be cautious.
(two)
Focusing on the category of buffets, its development index ranks to TOP5, and the index has reached the highest growth of all categories from the previous month, with 3.45%. Under the current consumption economy, the category that can make wallets safe and can be eaten casually.
(three)
On the whole, the commonality of the category with high development indexes at the moment is: high cost performance and category with rigid nature, which is just in line with the current economic background: consumers are not free to spare money, preferential consideration of "food and clothing".
Keywords: low customer order, extreme cost performance, retail, rigid need
Tea beverage analysis
1. Where is the opportunity for tea
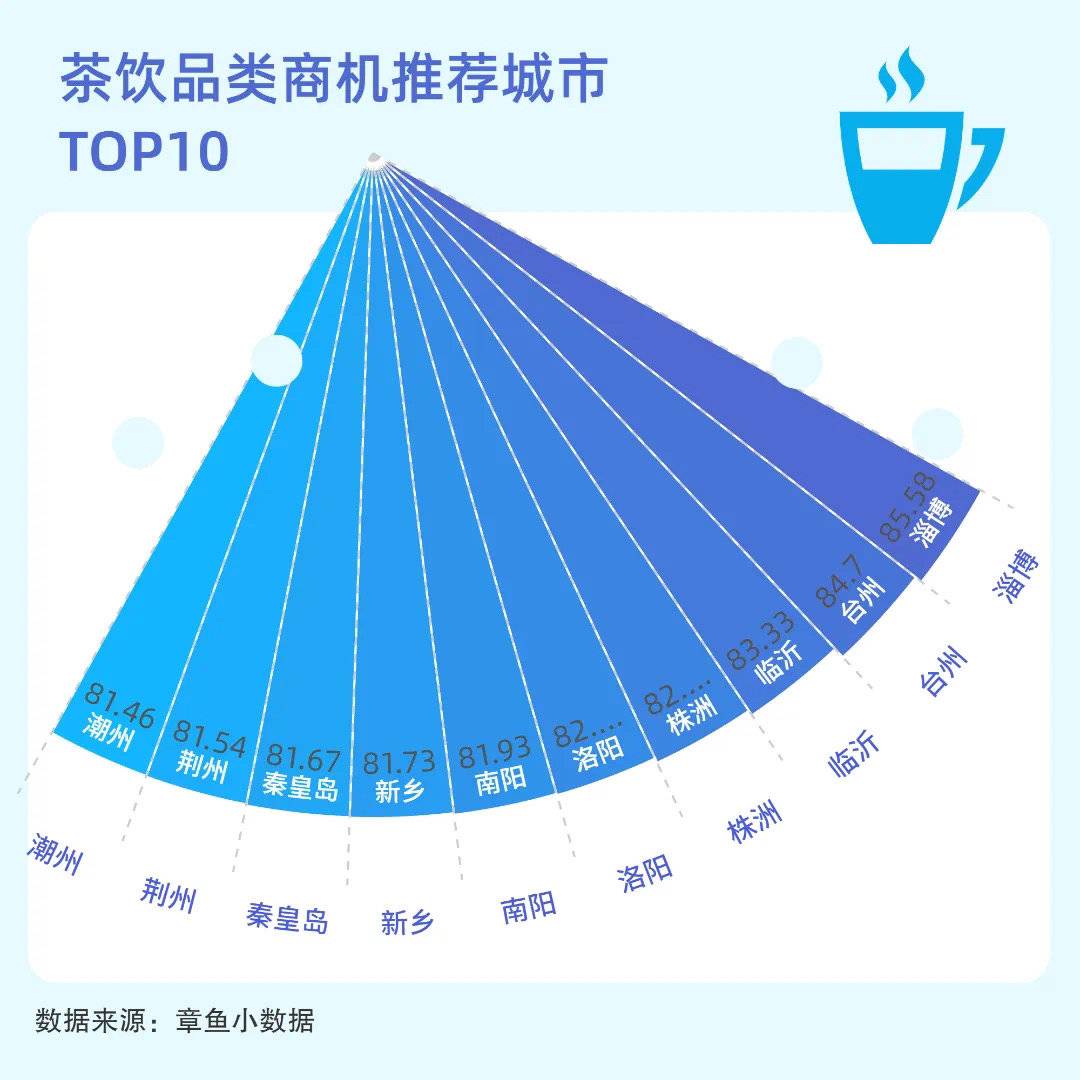
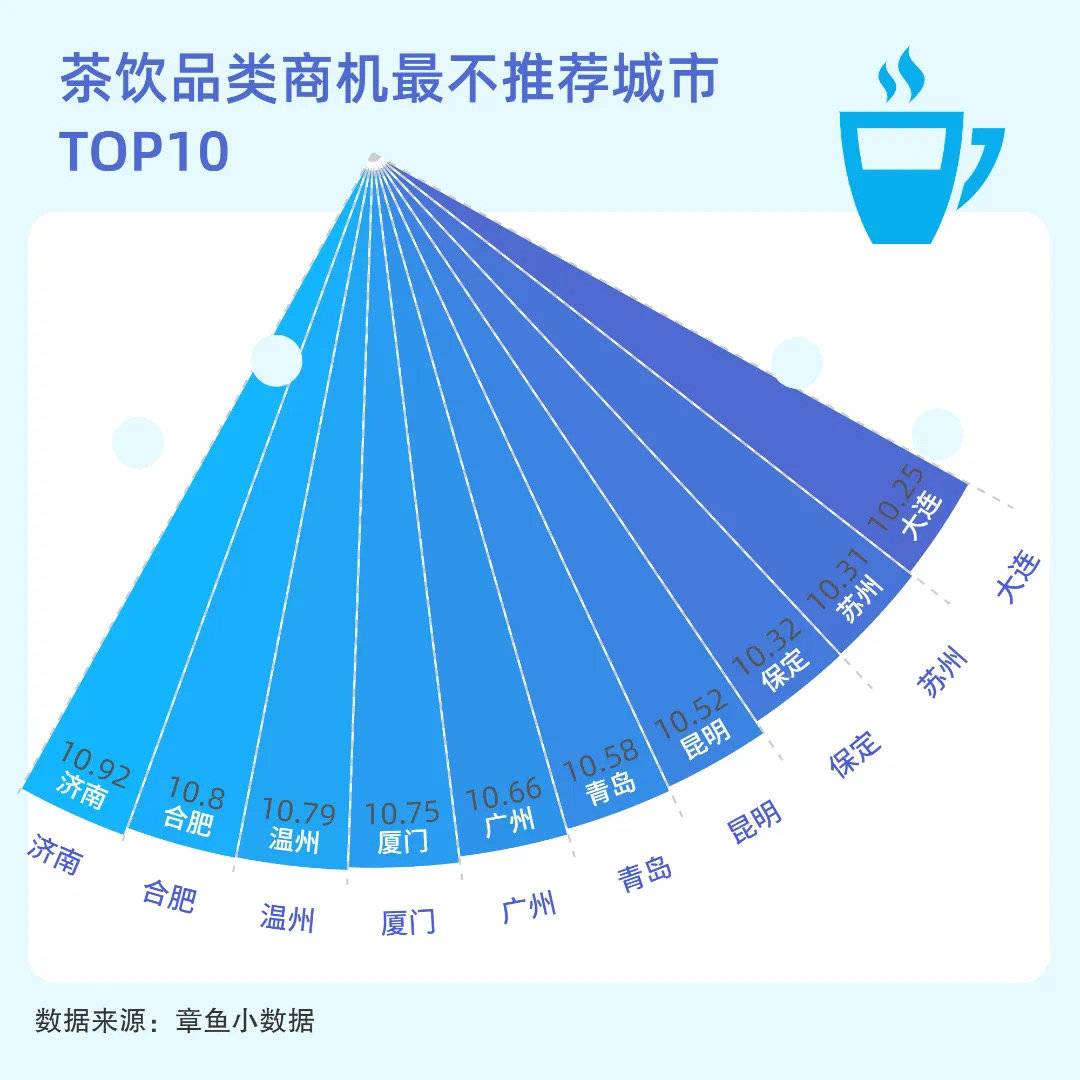
Take tea categories as an example to do a deeper interpretation: Where should I go to open a new store? Where can I open a new store? (Business opportunity recommendation index: combined multiple maintenances such as a certain category in competition, sales, repurchase, praise rate, new store growth and closure, etc., to focus on reflecting the heat and potential of the category in a certain area)
(The index is analyzed based on the relevant trend data of March-June)
Interpretation:
Looking at the two data charts, I believe you can easily conclude that the opportunity for tea drinks is in third- and fourth -tier cities.
The most recommended cities are all third and fourth -tier cities. The most recommended cities are new first -tier or second -tier cities. This is the same as the trend of e -commerce and retail industries: only the opportunity to sink the market.
Many of the third and fourth -tier cities in the table have achieved rapid economic growth in the background of the epidemic. For example, the first -ranking Linzi, in the first quarter of Linzi's GDP data, exceeded the 100 billion mark and increased by 5.6%. In the new first -tier and second -tier cities, the economy has slowed down, the market competition is huge, and the cake has basically been divided up. Please enter it carefully.
2. The opportunity to make tea in first -tier cities
First -tier cities still have a chance.
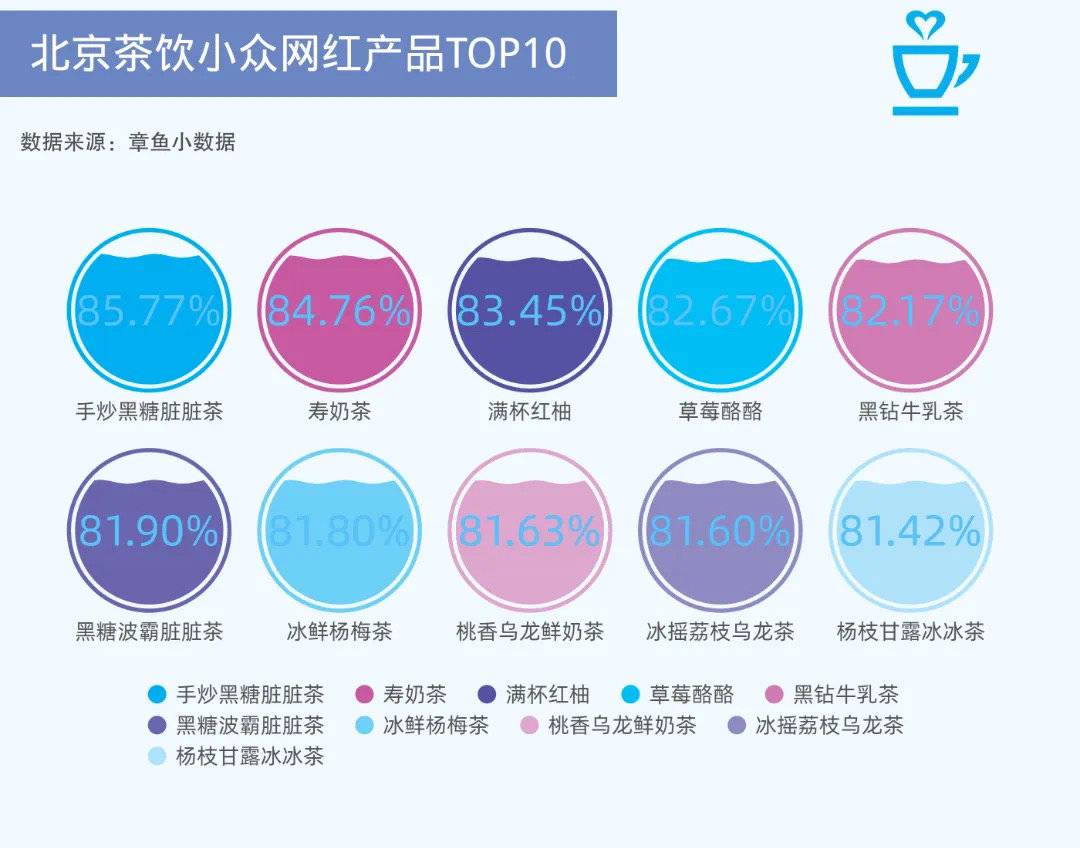
Instead of strength, creativity comes together. To get living space in first -tier cities, we need to start with product creativity to create your niche net red products.
(The index is analyzed based on the relevant trend data of March-June)
the core element:
To analyze with a typical first -tier city in Beijing, the core elements of these products when they are launched are: classic+innovation+seasonal
Practical gameplay:
Classic products, such as black sugar, red grapefruit, and poplars, with the concepts of innovation, such as: frying, full cups, ice, and then supplemented by seasonal ingredients such as lychee and peach incense. Together, it constitutes the popular law of Internet celebrity products: micro -innovation based on classic products.
If you want to excavate growth points from the product level in a fierce competition environment, you can start from the perspective of "classic product micro -innovation".
3. Use data to guide the pricing
(The index is analyzed based on the relevant trend data of March-June)
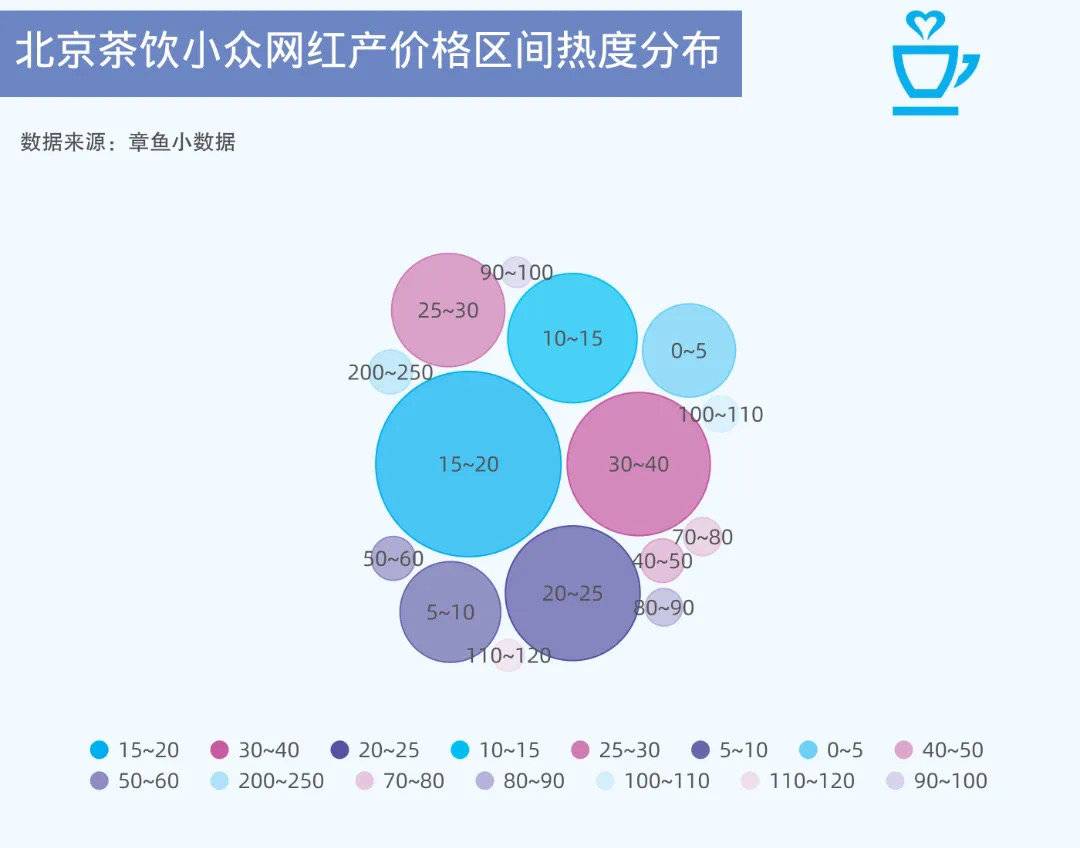
Continue to take the niche net red products of the Beijing tea market as an example to summarize the pricing law for everyone. Remember the conclusions in our first table? ——The reason why tea juice category has high development index: low -customer unit price
From the data point of view, the most mainstream price choice of the market is:
15-20 yuan
10-15 yuan
20-25 range
Pricing the product not only considers your cost, but also the current economic environment and consumption level. The existence of some details cannot be separated from the macro environment. This is the truth of falling.
It is recommended that those who have entered optimized the product experience and improved cost -effectiveness. Enterprises with core advantages can expand and develop. New entrants optimize the lower interval of the ultimate comparison experience.
Which categories are the best now
Jump out of the tea drink category and return to the macro environment to answer a question: "Which business can do now?" The data of the number of new stores, the number of closed stores, and other dimensions of multiple dimensions are drawn.
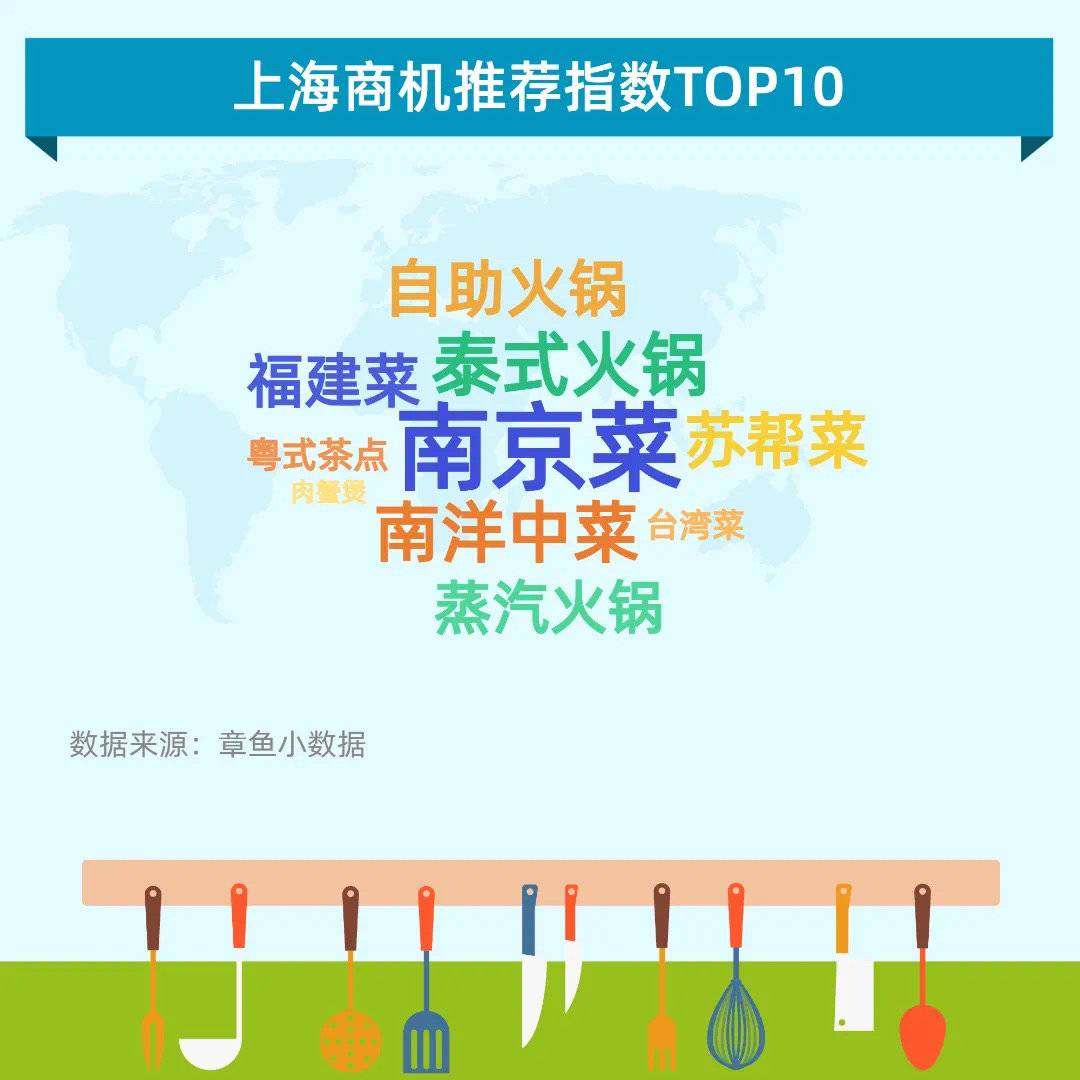
In order to better answer this question, we introduced a set of data -Shanghai Business Opportunities Recommended Index TOP10. Let everyone understand how to discover business opportunities from the data.
(The index is analyzed based on the relevant trend data of March-June)
Interpretation
01
Although the overall domestic catering development is difficult at present, it still cannot stop the prosperity of local catering, and the demand will always be there, just to see who is satisfied. Judging from the current business opportunity index: Nanjing cuisine, Thai hot pot, and Nanyang Chinese cuisine occupy the three -in -three business opportunity index. 02
These three categories are high -quality products, but combined with the current economic situation, it is recommended that you control the unit price of the customer and focus on the local flavor.
03
Special laws, Shanghai's business opportunity recommendation index is the biggest difference from other cities: the category of high -quality unit prices is the most recommended. I guess that after a long period of time, the people of Shanghai are willing to eat it.
Opportunities for ingredients
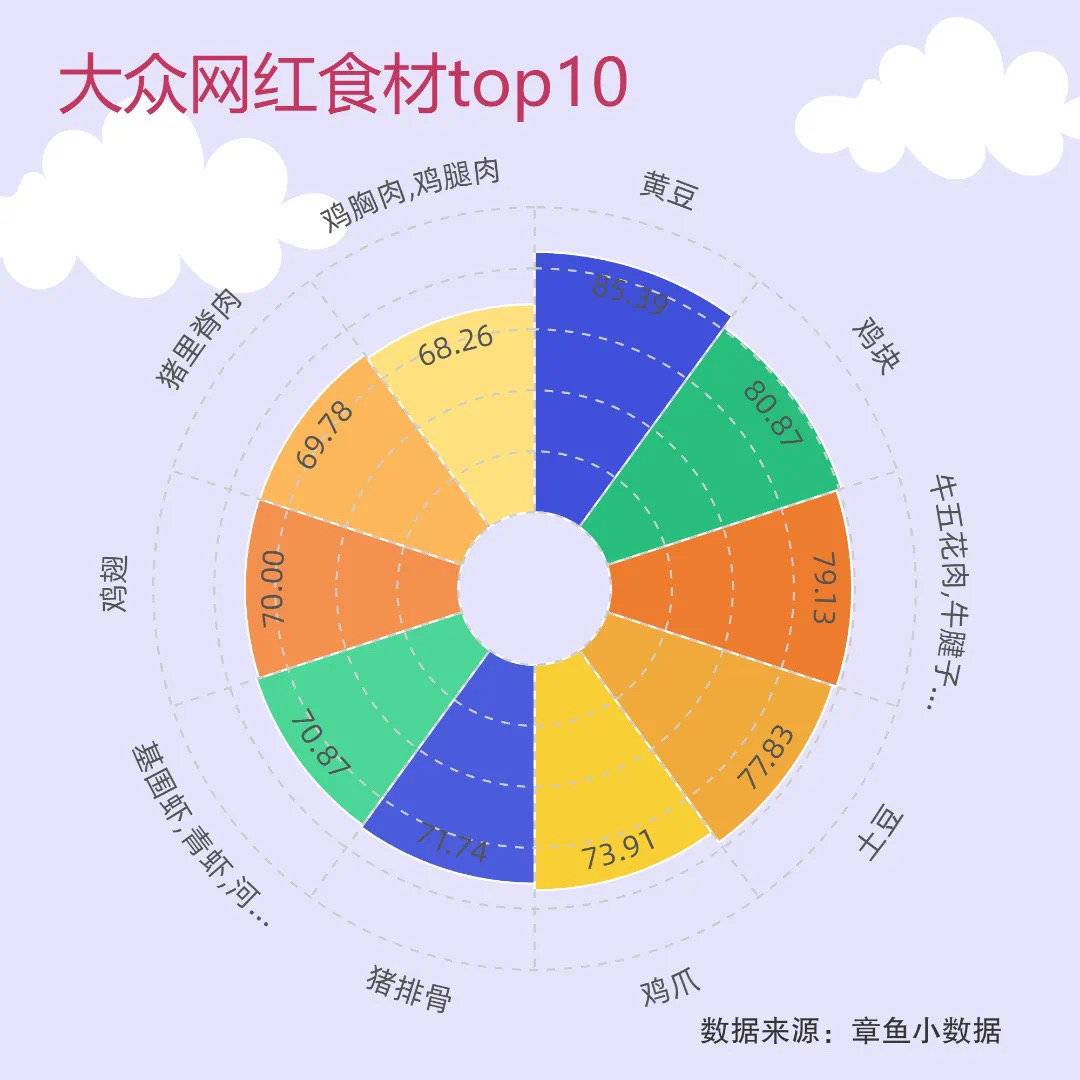
Finally, let us return to the essence and see where the current scale is at the ingredient level. "TOP10 of Volkswagen" reflects the popularity of ingredients in the current food ingredients (the number of dishes, consumption conditions, satisfaction, etc.)
(The index is analyzed based on the relevant trend data of March-June)
Interpretation
In June, the national ingredients are represented by many online celebrity chain stores, and the best performance of the ingredients that are replicated to form a duplicate trend is soy products. Due to the diversity of processing, and the value of consumer experience, soy products can bring merchant gross profit space and sales well.
Followed by chicken products, including chicken pieces, chicken wings, chicken feet and chicken breasts, chicken legs. However, due to the high cost of chicken -related ingredients this year, the profit for catering companies is not small.
Bull products are mainly concentrated in beef, beef tendon and beef ridge meat. However, the launch of cattle products is average. The main reason is that the price is difficult to meet the cost -effective and low -priced consumption needs of the current consumer.
Shrimp products currently have very good development space. On the basis of satisfying high -protein and quality consumption, cost prices have a good room for catering companies.
Data Sources
The data comes from the large database of octopus small data dishes (on the basis of online platform big data, cashier data, and consumer data, the monthly dynamic database built in depth). The big database of the dishes has been precipitated for 6 consecutive years, covering nearly 3 million+ million stores, 200+categories, nearly 5,000+ ten thousand dishes SKU, 1000+ingredients, and analyzed the label dimension 110+.
Model indicator description
Octopus product development index
Category_development_index (CDI)
This index is mainly used to help catering companies determine whether the overall development of the current category is good and in what stage of the category. It provides a macro reference for the formulation of business strategy. This model is based on urban and secondary categories. Through the performance of various stores in each data dimension, it obtains a comprehensive score and calculates the annual monitoring and learning of each month through the hidden layer of the neural network to achieve the adaptive threshold. Change and output market hierarchical judgments, which are currently the performance of various secondary categories in each city. After optimization, the localization algorithm is added, which can currently achieve market judgments at all levels of the country, regions, and provinces.
2. Octopus business opportunity recommendation index
Opportunity_referral_index (OPI)
This index is mainly used to guide catering companies to determine which cities in which cities are currently investing, opening, and expanding opportunities. According to different regional dimensions, the multi -dimensional monitoring of the dishes of each month of the data is performed, and the classification and calculation of the decision tree are divided into three types: popular products, net red products, and conventional products. , Summarize upwards, return to various secondary categories after the hidden layer fusion calculation, and re -assign the laws of self -research to calculate the development indexes of various categories across the country.
3. Octopus Product Index-Volkswagen Introduction INFLUENCER_INGREDIENT_INDEX (TRI)
This index is mainly used to guide the ingredients that catering enterprises and supply chain companies are focusing on and creating when product development and upgrades.
Volkswagen's ingredients index is more than three months of data through continuous monitoring databases, setting environmental scores, taste scores, business scores and other indicators and its indicators. As the first layer of filtering the division of the decision tree, the first monitoring data is divided, and after the division, it enters the hidden layer calculation. With the characteristics of the product itself, it is an ultra -redeee point (product heat, product size scale, product satisfaction, product index, etc.). Divergence calculations are finally calculated through the data of continuous monthly data to obtain the output result and adaptive product index generated.
[If you have news clues, please report to us. Report WeChat Follow: IHXDSB, Report QQ: 3386405712]
- END -
He was fined more than 10 million in less than half a year!What should I do if the foreign investment will abandon the position of the major shareholders?
The Bank of Hangzhou was fined 5.8 million yuan by the People's Bank of China for ...
Sure enough, shelter!Foreign capital is 17 billion to kill A shares, and buy this giant over 2 billion

Source: E companyLast week, due to the sharp interest rate hike in the Fed and the...